> For the complete documentation index, see [llms.txt](https://limechatai.gitbook.io/limechat-product-guide/llms.txt). Markdown versions of documentation pages are available by appending `.md` to page URLs; this page is available as [Markdown](https://limechatai.gitbook.io/limechat-product-guide/client-shareable-docs/how-to-understand-the-broadcast-ui-metrics.md).
# How to understand the Broadcast UI Metrics
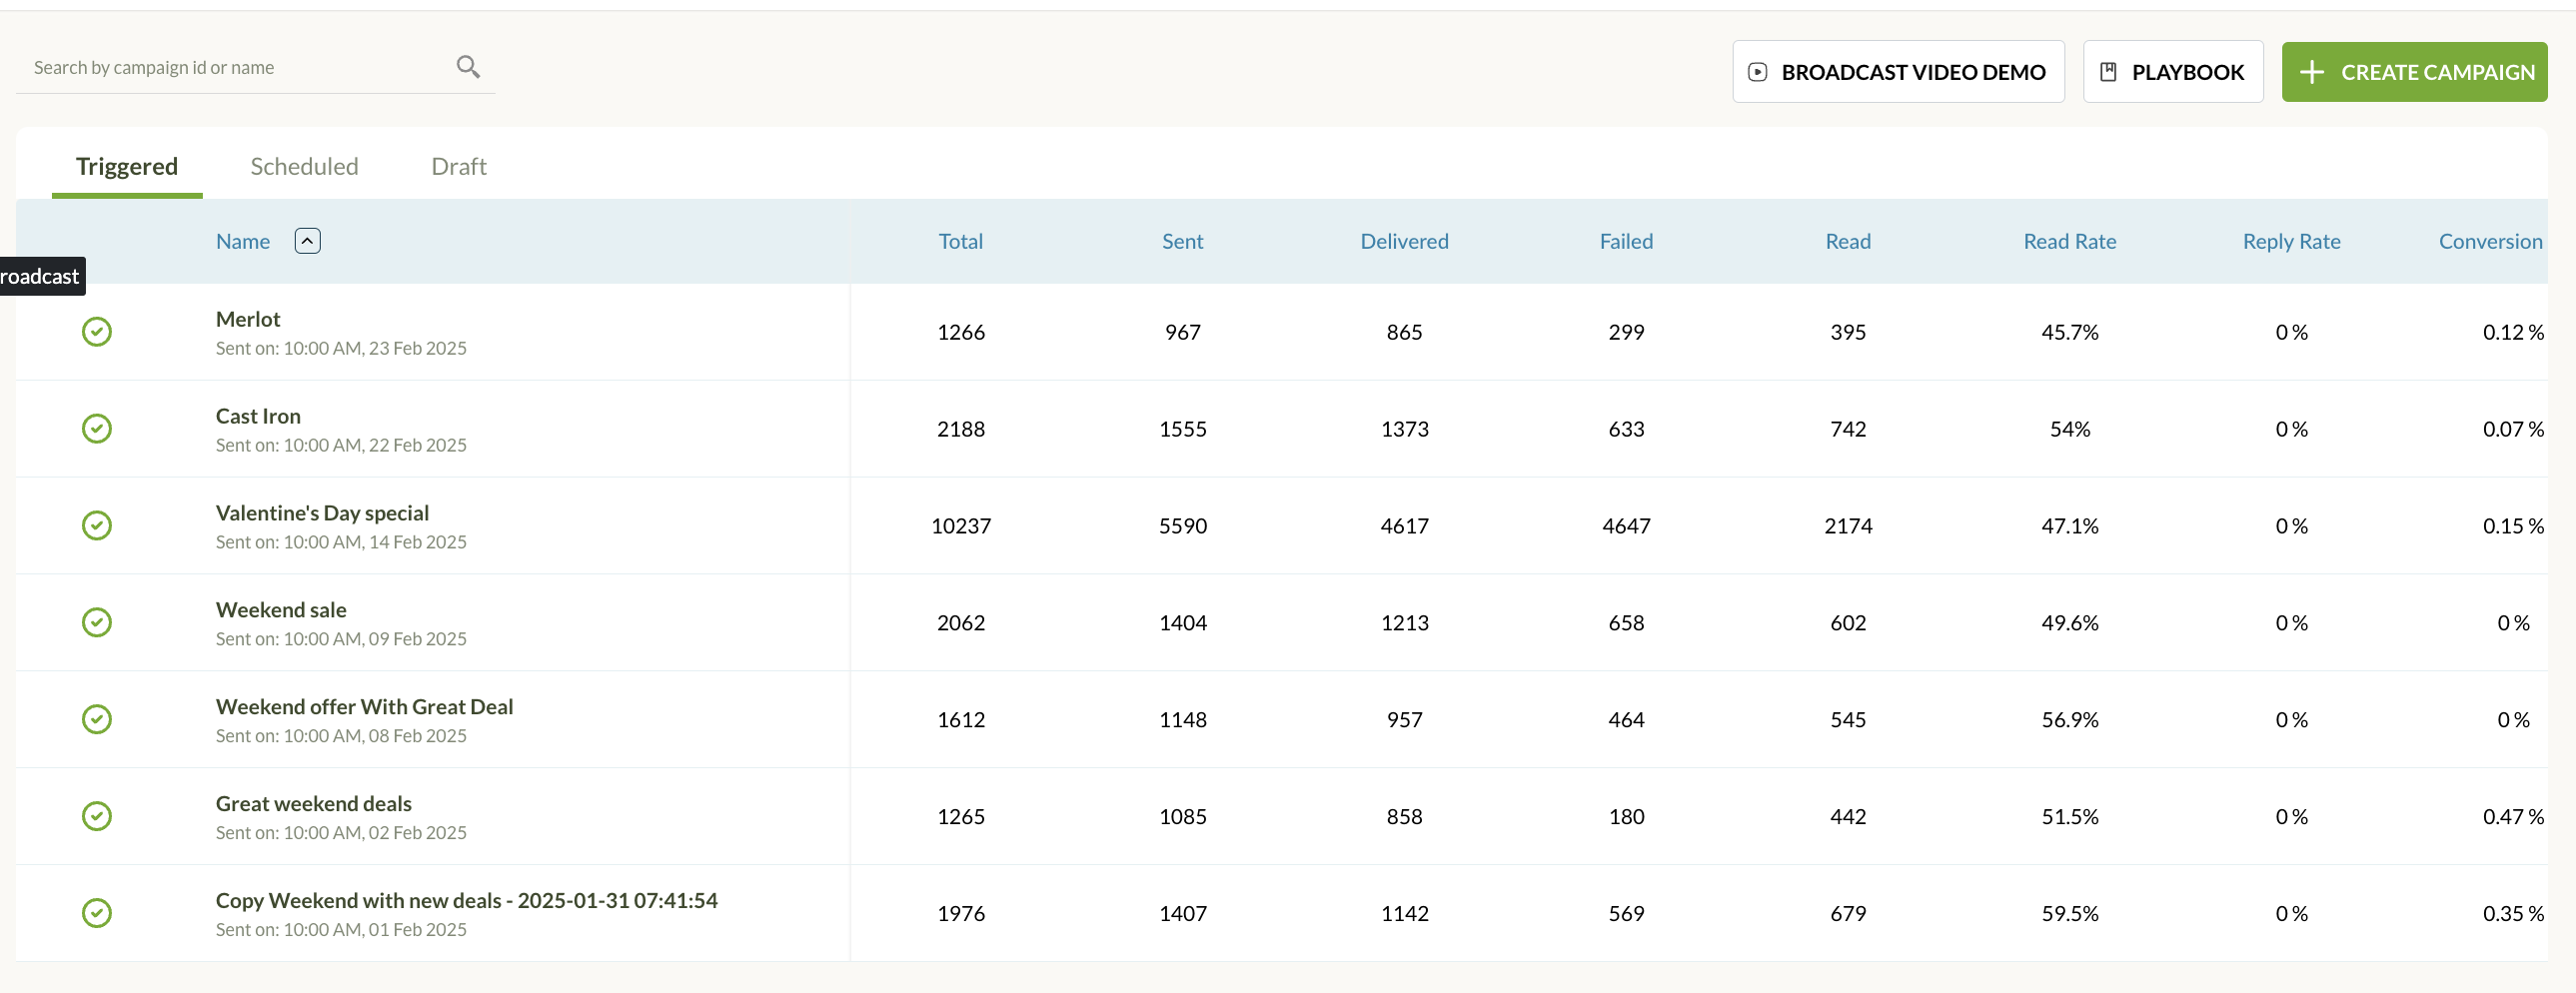
OverviewCommentShare feedback on the editorThis document explains the different metrics in the **Broadcast UI** and how they are calculated.CommentShare feedback on the editorCommentShare feedback on the editorThis table outlines the different metrics in the Broadcast UI and how they are calculated.CommentShare feedback on the editor
| **Metric** | **Description** |
| --------------------------- | -------------------------------------------------------------------------------------------------------------------------------------------- |
| **Total** | Sum of **Sent** and **Failed** messages. |
| **Sent** | Messages triggered from LimeChat’s system. |
| **Failed** | Messages that failed to send due to issues like an incorrect or non-existent number. |
| **Delivered** | Messages successfully received by the user’s device. This may be lower than **Sent** due to factors like frequency capping or BSP errors. |
| **Read** | Number of messages that were opened by users. |
| **Read Rate** | Percentage of **Delivered** messages that were opened. Formula: `Read ÷ Delivered × 100` |
| **Reply Rate** | Percentage of **Read** messages where users responded. Formula: `Replies ÷ Read × 100` |
| **Conversion Rate** | Measures engagement, typically based on user replies or interactions. |
| **Click-to-Response (CTR)** | Number of times users clicked a link within the message. Does not indicate if an order was placed or further interactions occurred. |
| **Revenue** | Revenue generated from users clicking a link and placing an order. Only counted if the purchase occurs after interacting with the broadcast. |
CommentShare feedback on the editorCommentShare feedback on the editor[ ](https://app.gitbook.com/o/4Lfr62NemLcosNZYG4H3/s/bX4xjPD7aB6o9V5WDDF9/campaign/common-faqs/understanding-flow-reports-and-analytics-key-differences-and-troubleshooting)